
One real-time system for energy monitoring, demand forecasting, and automated peak shaving with AI-assisted decisions — built for Malaysian TNB users.
TNB's 30-minute MD blocks create billing cliffs. A single surge can exceed 40% of total electricity cost — and by the time you see it, the billing period has closed.
Manual meter readings and delayed reporting leave you always reacting, with no time to turn raw data into a decision that stops a peak before it starts.
Inefficiencies in HVAC, lighting and motor circuits go unnoticed. Power factor issues add phantom charges nobody sees until the bill arrives.
Responding to peak demand requires constant vigilance. Without automation, managing multiple sites is impossibly costly.
Metering, alarms, automation and reporting — walked through on real ENRGiQ screens.
Real-time power data from every meter — 30-minute MD blocks aligned to TNB billing cycles.
AI predicts peak demand 5–10 minutes before it hits your ceiling, giving you time to respond.
Automated load control sheds non-critical circuits to prevent peak charges. All rule-based and auditable.
Full audit trail: kWh trends, kVAR, power factor, per-phase analysis. CSV export for billing validation.
Monitoring & alarms are always included. Automation & reporting are add-ons.
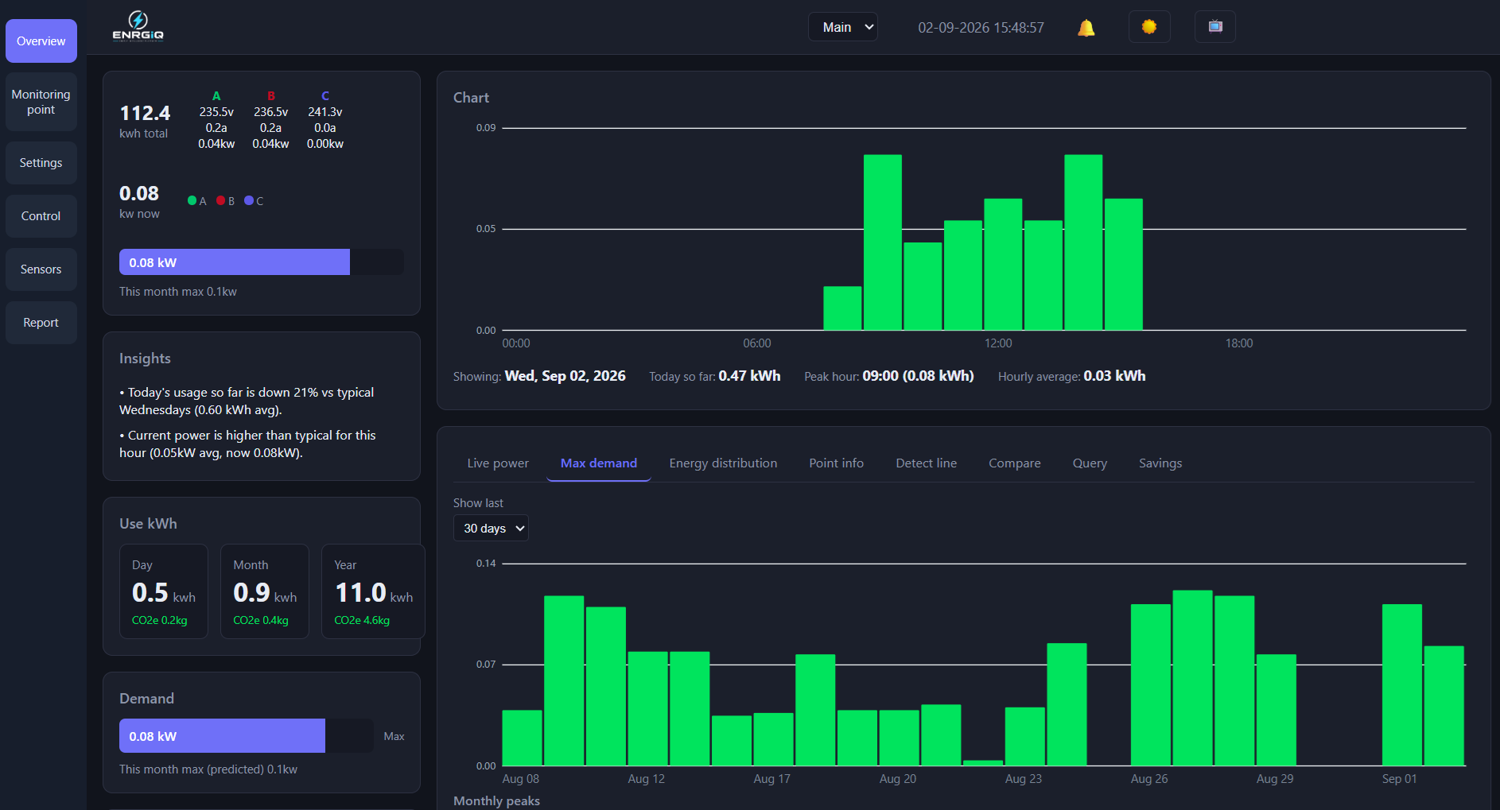
Live power data — kW, kVAR, voltage, current, power factor — from every meter, updated every 1–5 seconds. 30-minute MD blocks aligned to TNB billing cycles, with UTC+8 timezone enforced throughout.
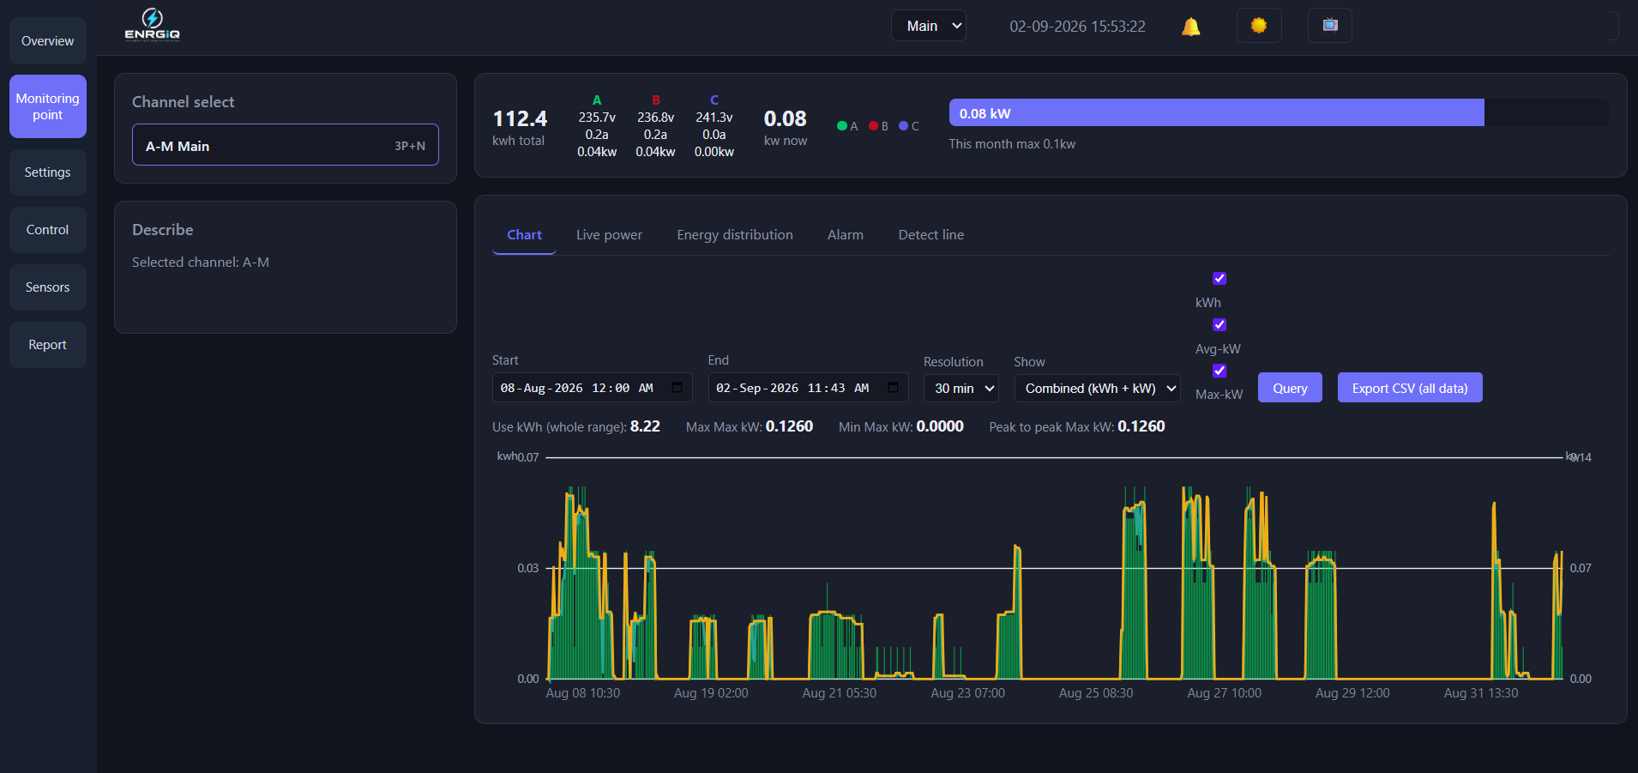
Power and energy plotted over any date range, with a live "now" reading pushed to screen — plus an automatic polling fallback, so a dashboard left open on a wall-mounted screen never goes stale.
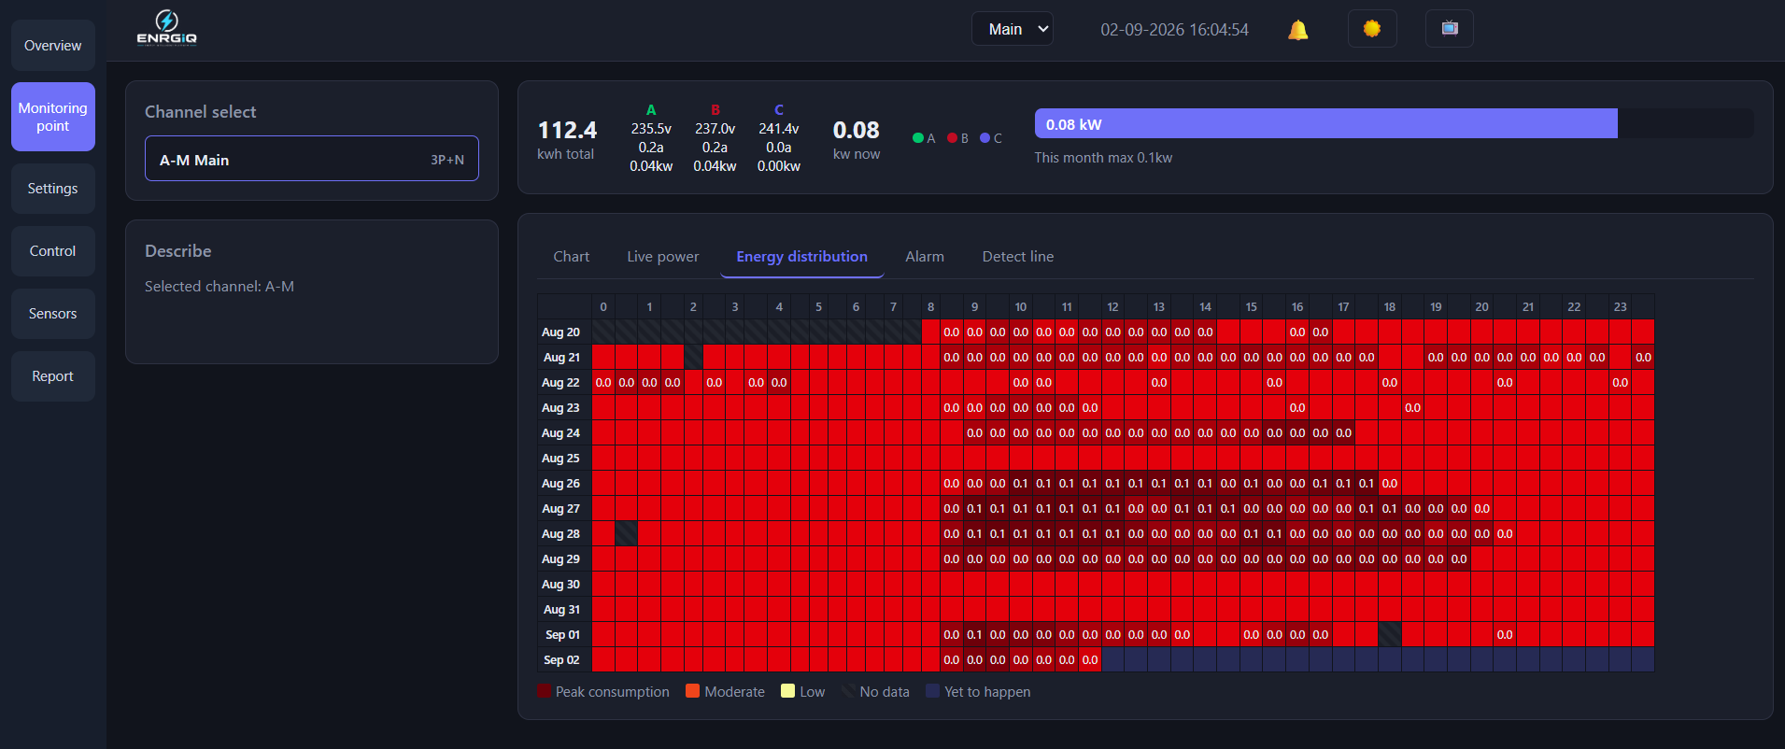
An hour-by-hour, day-by-day heatmap of consumption intensity, so peak-consumption windows are visible at a glance instead of buried in a spreadsheet.
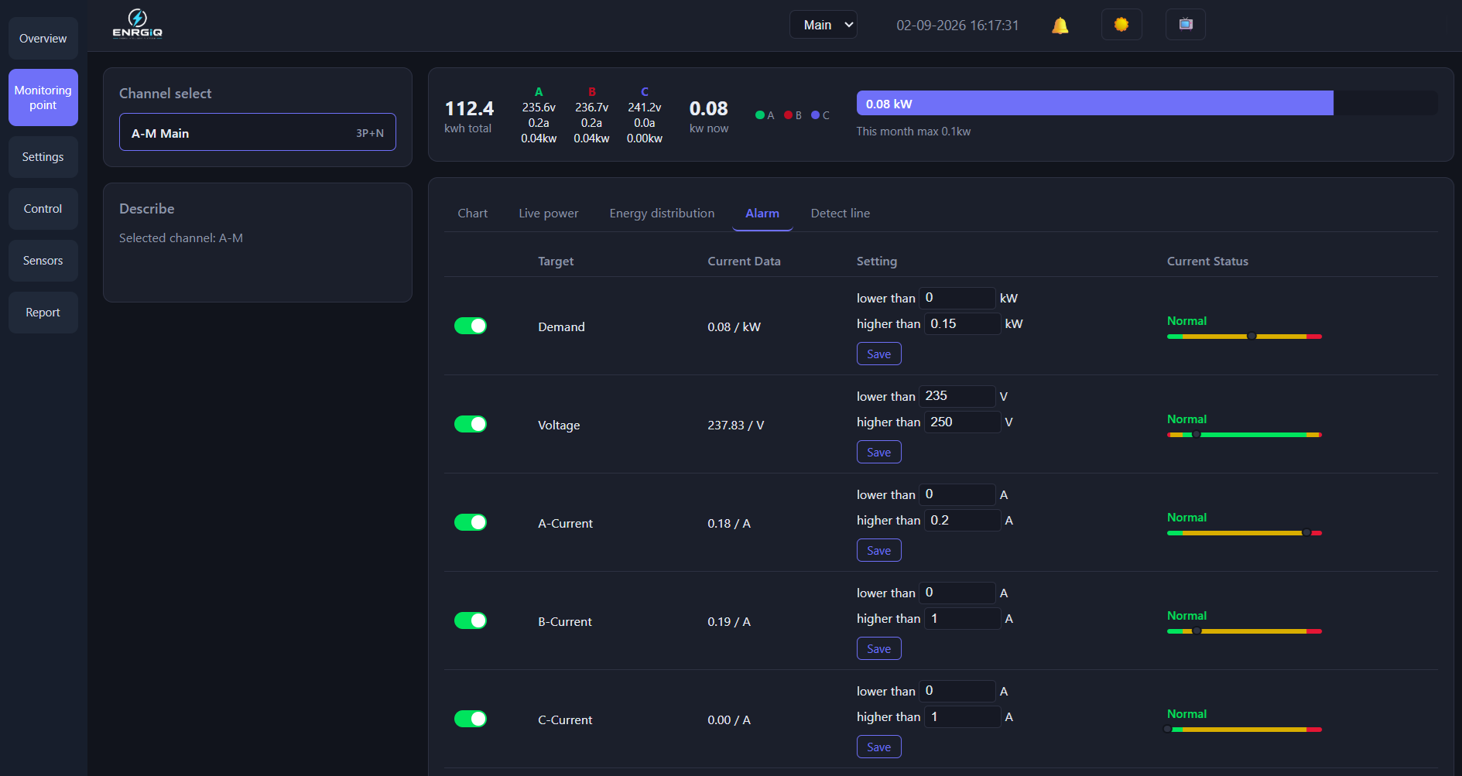
AI models analyze live data against TNB's 30-minute MD blocks and predict peak demand 5–10 minutes before the billing window closes. Per-meter alarm rules for demand, voltage, current and daily kWh limits, delivered by email/SMS and on the dashboard — giving time to actually respond.
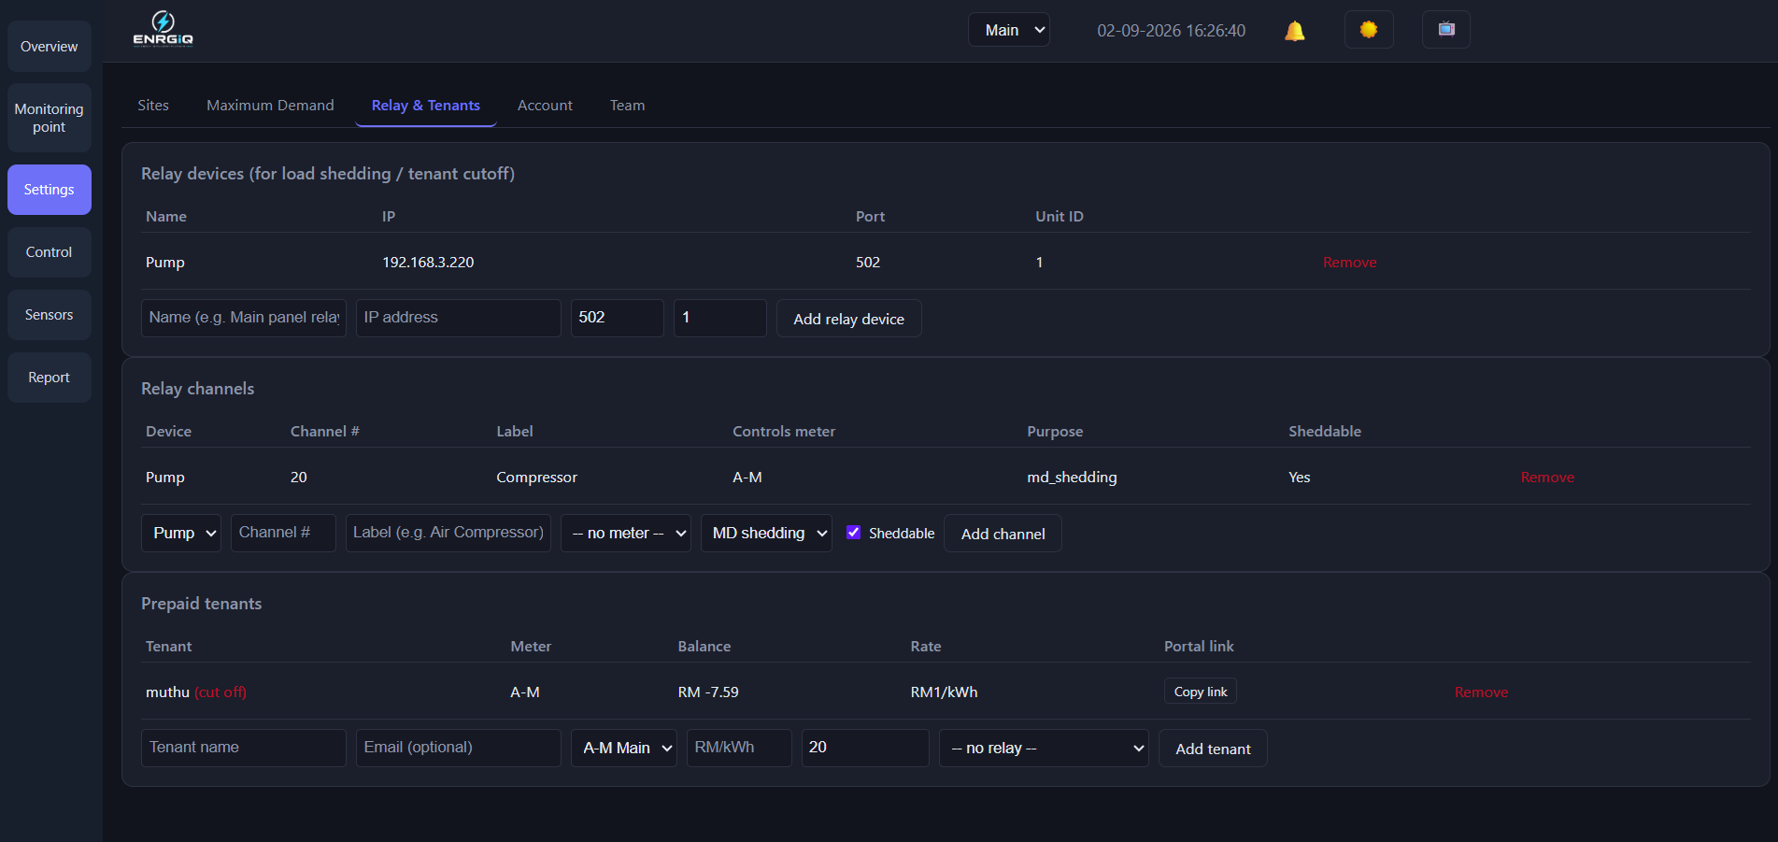
Rule-based relay control — define rules like "if demand exceeds the contracted block, shed the compressor circuit for 10 minutes." Relay devices and channels are configured per site, with prepaid tenant sub-metering and cutoff built in for shared facilities.
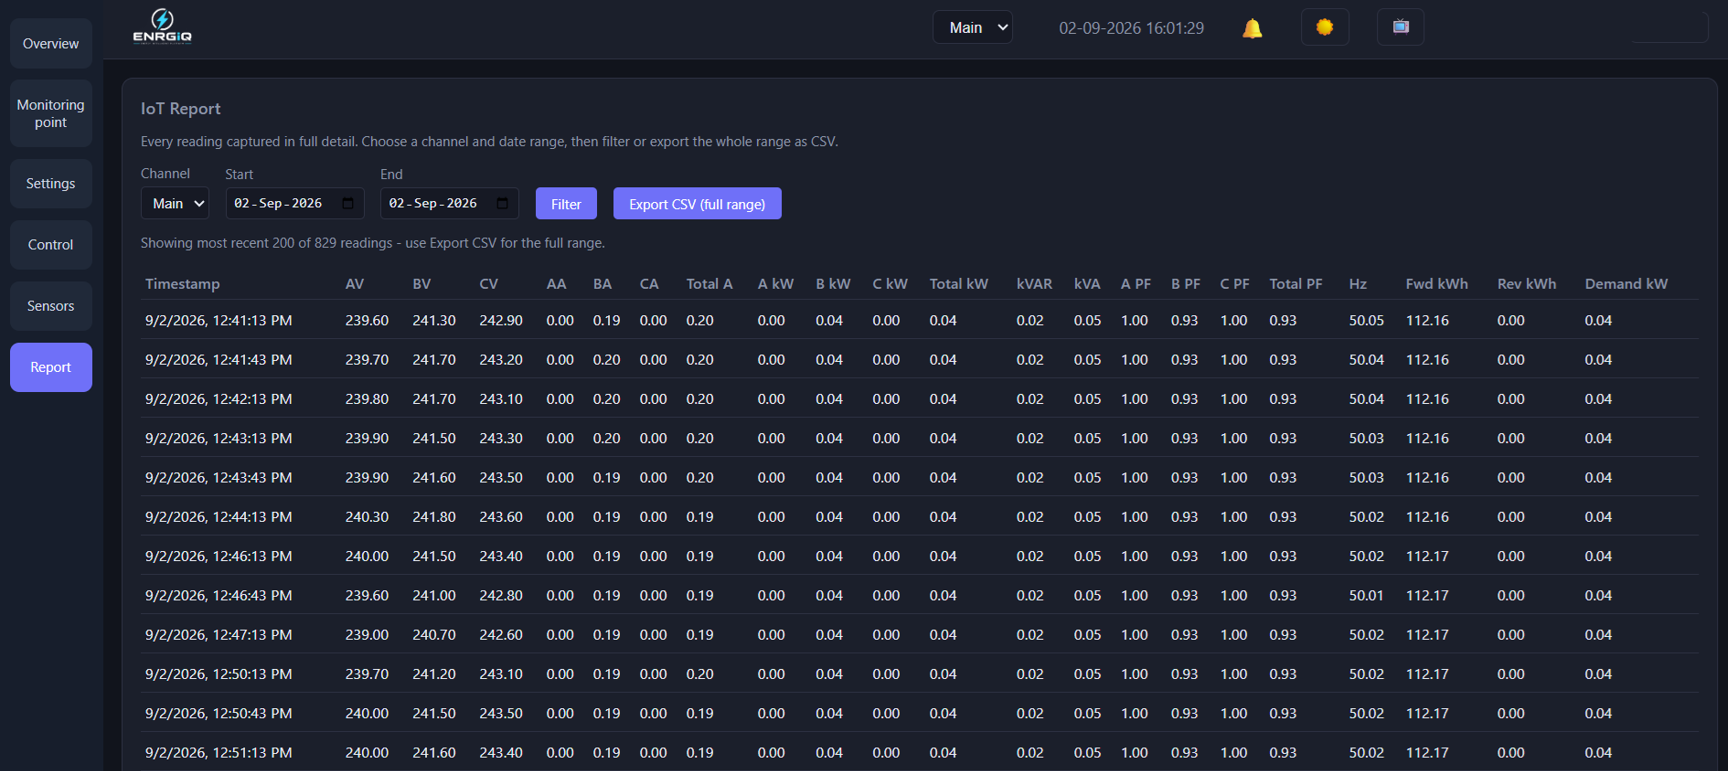
Full audit trail down to the individual reading — voltage, current, power, power factor, frequency, forward/reverse kWh — filterable by channel and date range, with CSV export for the full range.
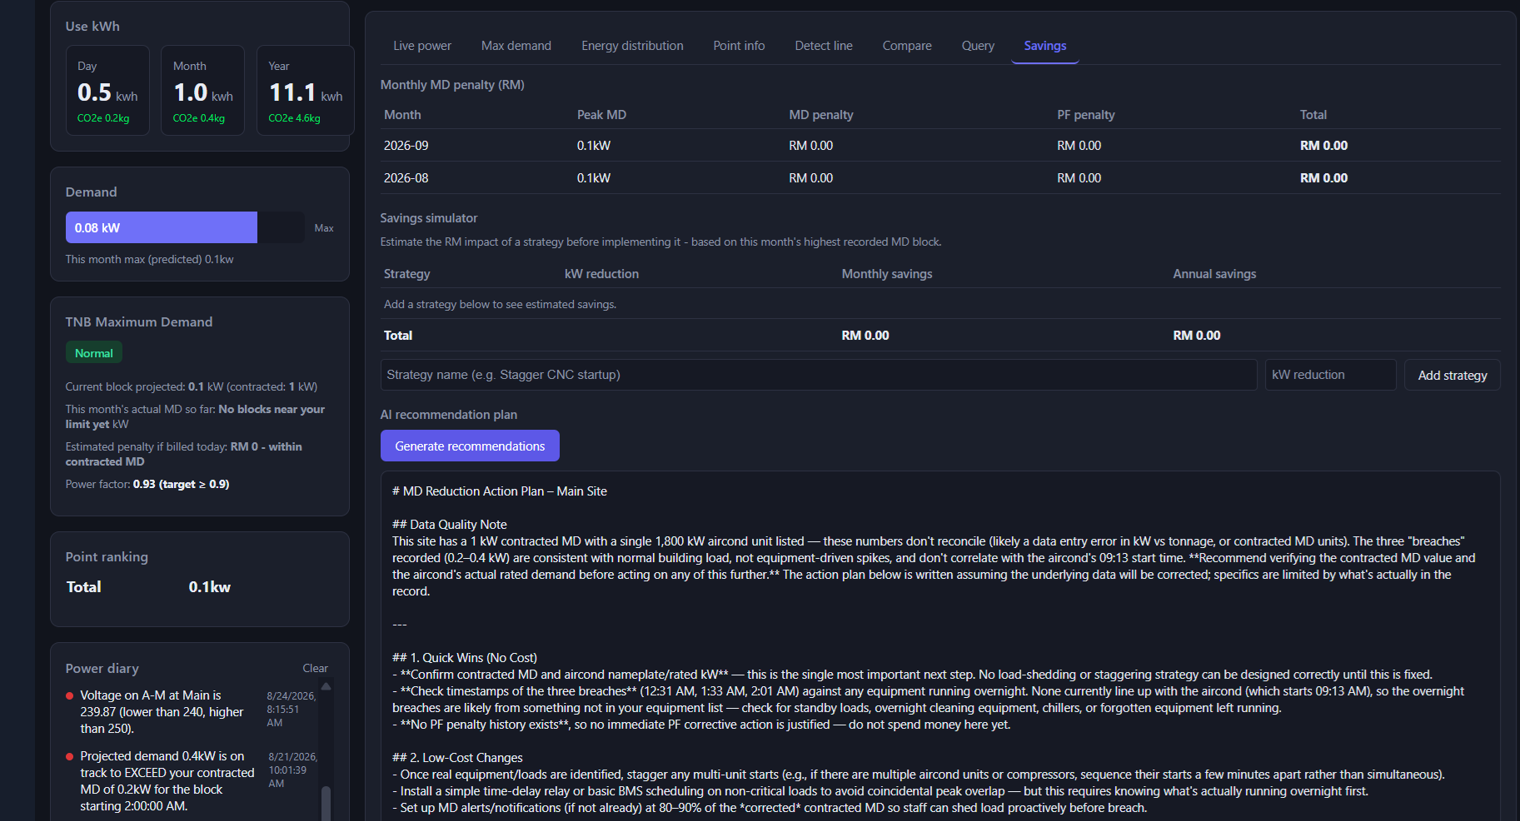
No training required for basic monitoring — alarms go straight to the facility manager's email or SMS. The Savings tab tracks MD penalty exposure by month, simulates the ringgit impact of a strategy before you implement it, and can generate an AI-written reduction action plan from the site's own data.
Rated against a standard energy platform rubric, using each vendor's published feature list.
| Feature | ENRGiQ | Other vendors |
|---|---|---|
| Monitoring | Yes | Yes |
| MD prediction | Yes (AI) | No |
| Automation | Yes | Partial |
| Cloud dashboard | Yes | Yes |
| Multi-site | Yes | Some |
| Affordability | Fraction of enterprise cost | High |
| Phased deployment | Yes | No |
No single competitor covers real-time monitoring, predictive alerts, automation and reporting all in one affordable platform.
30-minute MD blocks, peak shaving logic, Malaysia-specific billing knowledge built in from the ground up.
Monitor → Alert → Automate. No forced all-or-nothing — start with visibility, add features when ready.
Malaysia-based team, local support, deep TNB billing understanding.
A fraction of enterprise BMS platform cost. Per-meter pricing scales with your needs.
15–30% peak demand reduction, 3–8 month payback. Not vague "efficiency gains."
Start with monitoring alone. Automation and reporting are independent add-ons, not bundled requirements.
Illustrative scenario — actuals depend on site load profile and contracted MD.
| Peak demand charge share of bill | ~40% |
| MD reduction | 20–30% |
| Payback period | 3–8 months |
| IRR | 70–150% |
Most competing platforms require a 6–12 month payback. ENRGiQ's phased deployment and lower implementation cost bring that down to 3–8 months.
One building. A few meters. Four to six weeks. See your peak demand drop.
Up to 5–10 meters, on the facilities you choose — not a one-size-fits-all pilot.
Real-time monitoring, predictive alerts, basic automation testing, AI insights.
Live and reporting within four to six weeks of kickoff.
Tell us a bit about your facility and we'll set up a walkthrough.